IP telemetry use case
In order to master and understand the data flows of his IP network, this client wanted to have an IP telemetry system open, flexible and easy to integrate into their product and business logic. Pragma Analytics Software Suite (PASS) was used to collect Netflow, IPFIX, and sFlow tickets, as well as to collect routers’ system statistics and information. The main use cases are:
- Dashboards for engineering and network planning teams,
- Traffic reports for teams in charge of BGP peering,
- Dashboards for security teams,
- Identification of DoS DDoS attacks,
- Intrusion identification,
- Post mortem analysis, Forensic investigation on all flows stored on the PASS system.
The ingestion layer of IP flows, also ensures the enrichment of IP telemetry data
- A first enrichment is to make a lookup in the BGP routing table of the router (the router is configured to propagate its BGP table on the BGP stack of PMACCT module (stack Quagga)). The flow source and destination IP addresses are associated with their BGP prefix and all their attributes.
- A second enrichment is to make a lookup of source and destination IP addresses in a geolocation database (https://www.maxmind.com). A free version of this database is usable with a country granularity.
- Finally, a third enrichment is carried out in order to correlate the indexes of the interfaces of the routers with the SNMP information relating to these interfaces (description of the interface, name of the interface, alias).
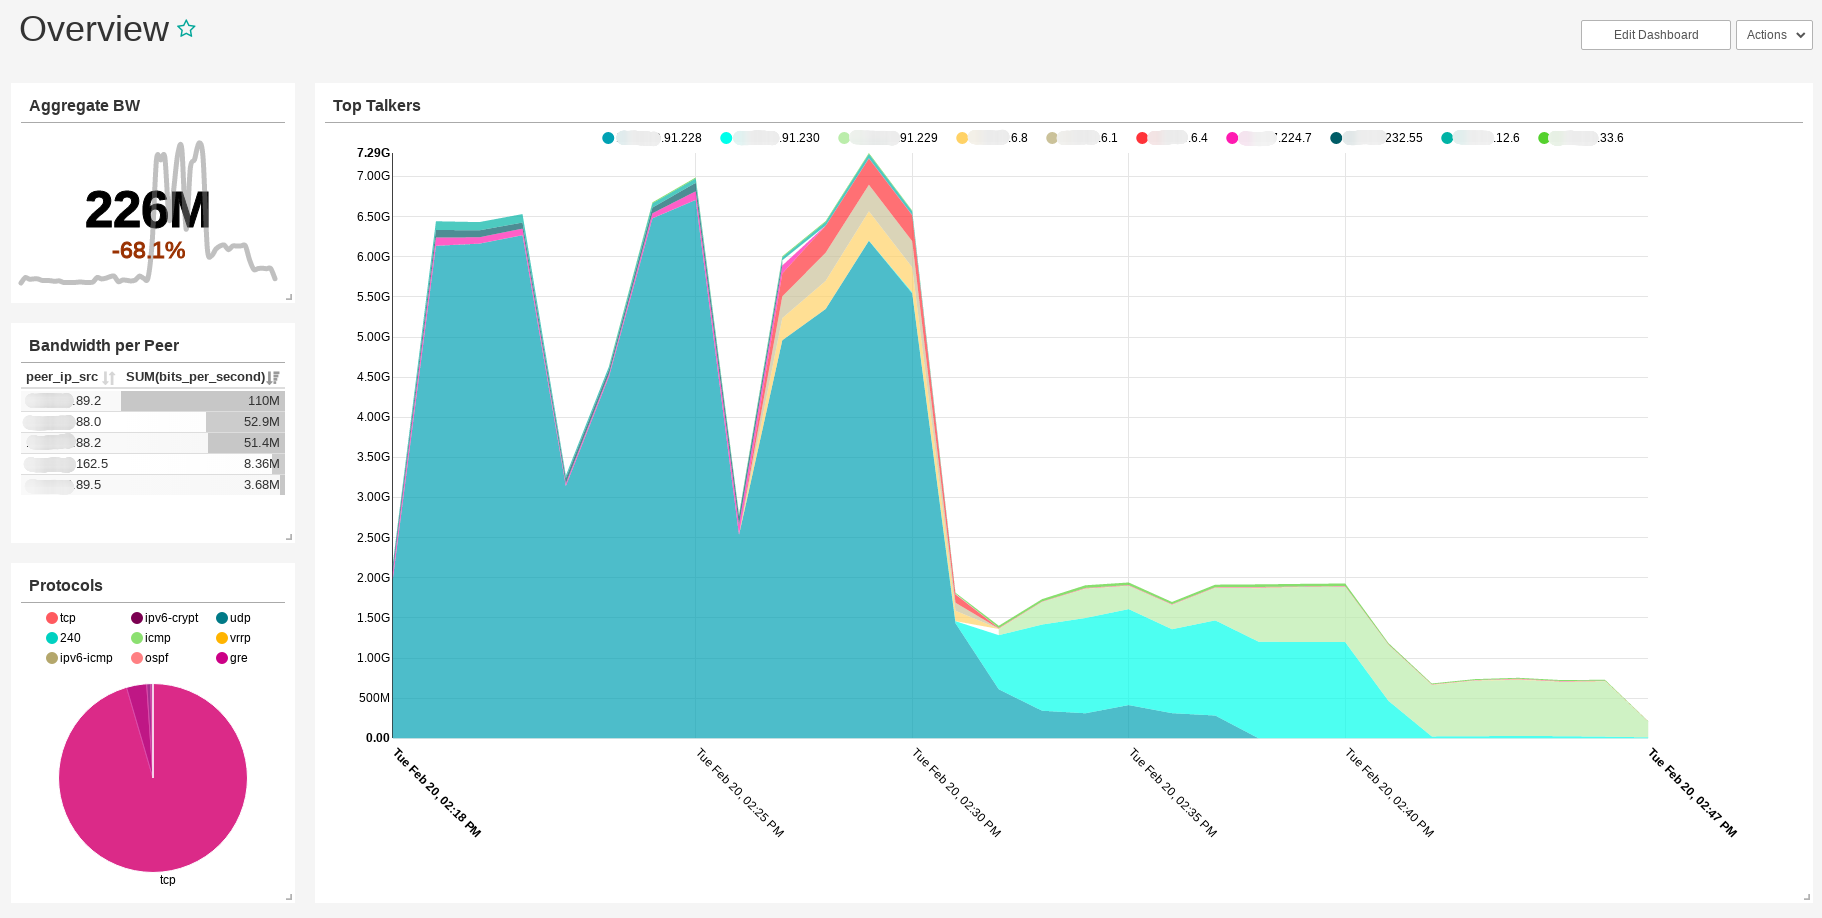
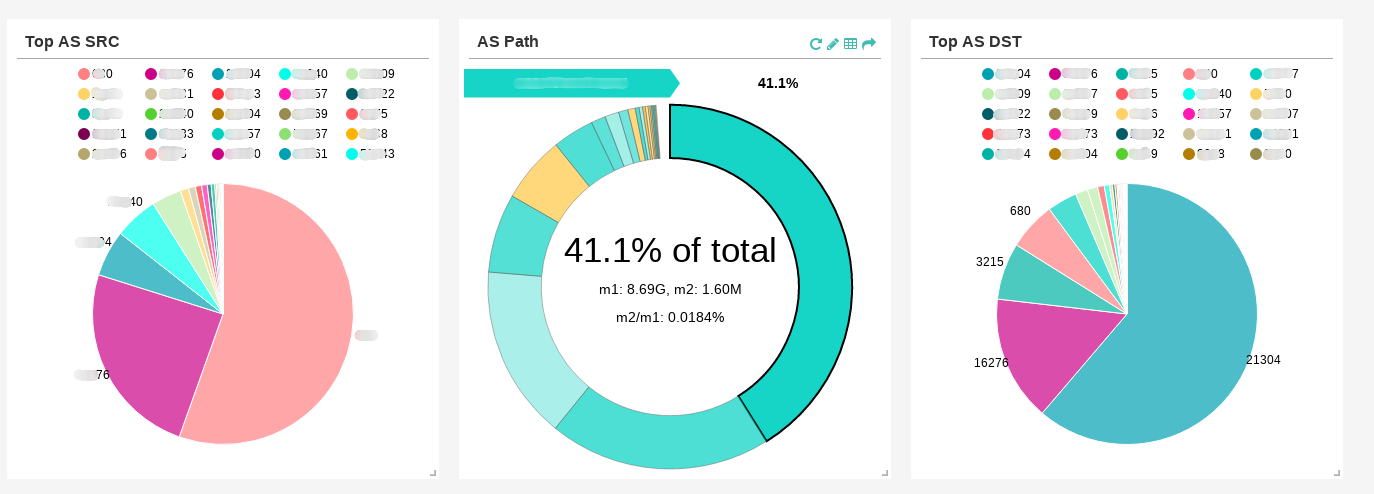
Control and understand your peering and your network engineering
Based on this information, it is possible to do analyzes your traffic per ORIGIN ASN AS_PATH, BGP community, BGP Next-Hop … All these statistics are valuable tools for optimizing Internet connection costs and to optimize its network architecture. This information can also help in diagnosing when changing routing of the Internet and understand potential traffic flip-flops.
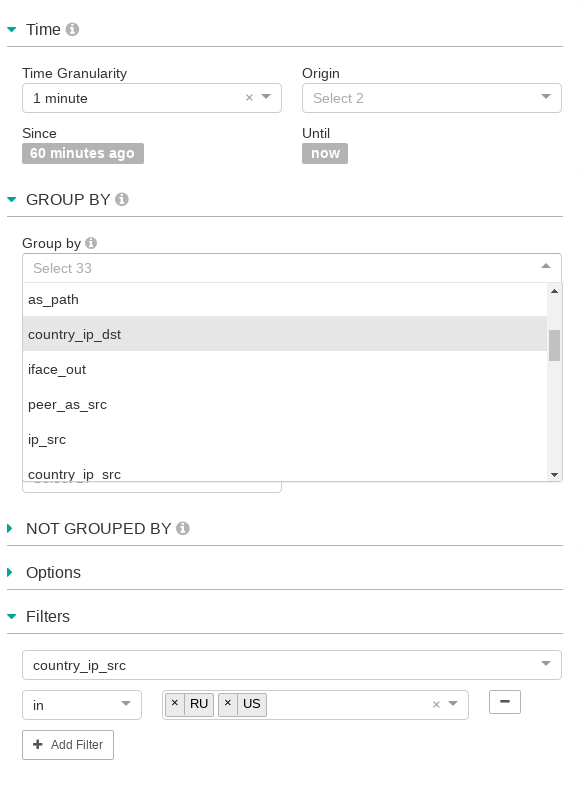
Build your query, Piece of cake !
You do not have to be an expert in SQL or JSON / RPC queries to view and aggregate data as you want to see them. The metadata of the big data base is loaded into the front end and simply offers the user an intuitive graphical interface. Here is an example of how the columns of the data model are introduced to the user.
We note that it is also very simple to change the duration on which one wishes to observe the data. The system being in near real time (the ingestion time may vary depending on the volume but will remain of the order of a minute), it is possible to see the data just ingested just at the time of the request ( until now).
Finally, it is also possible to filter the traffic that you want to observe by adding values for some columns. A logical OR will be applied to the values in this case. We will have traffic coming from Russia or USA only. The system also has metric condition like > = and <= also a Regexp engine for advanced users!
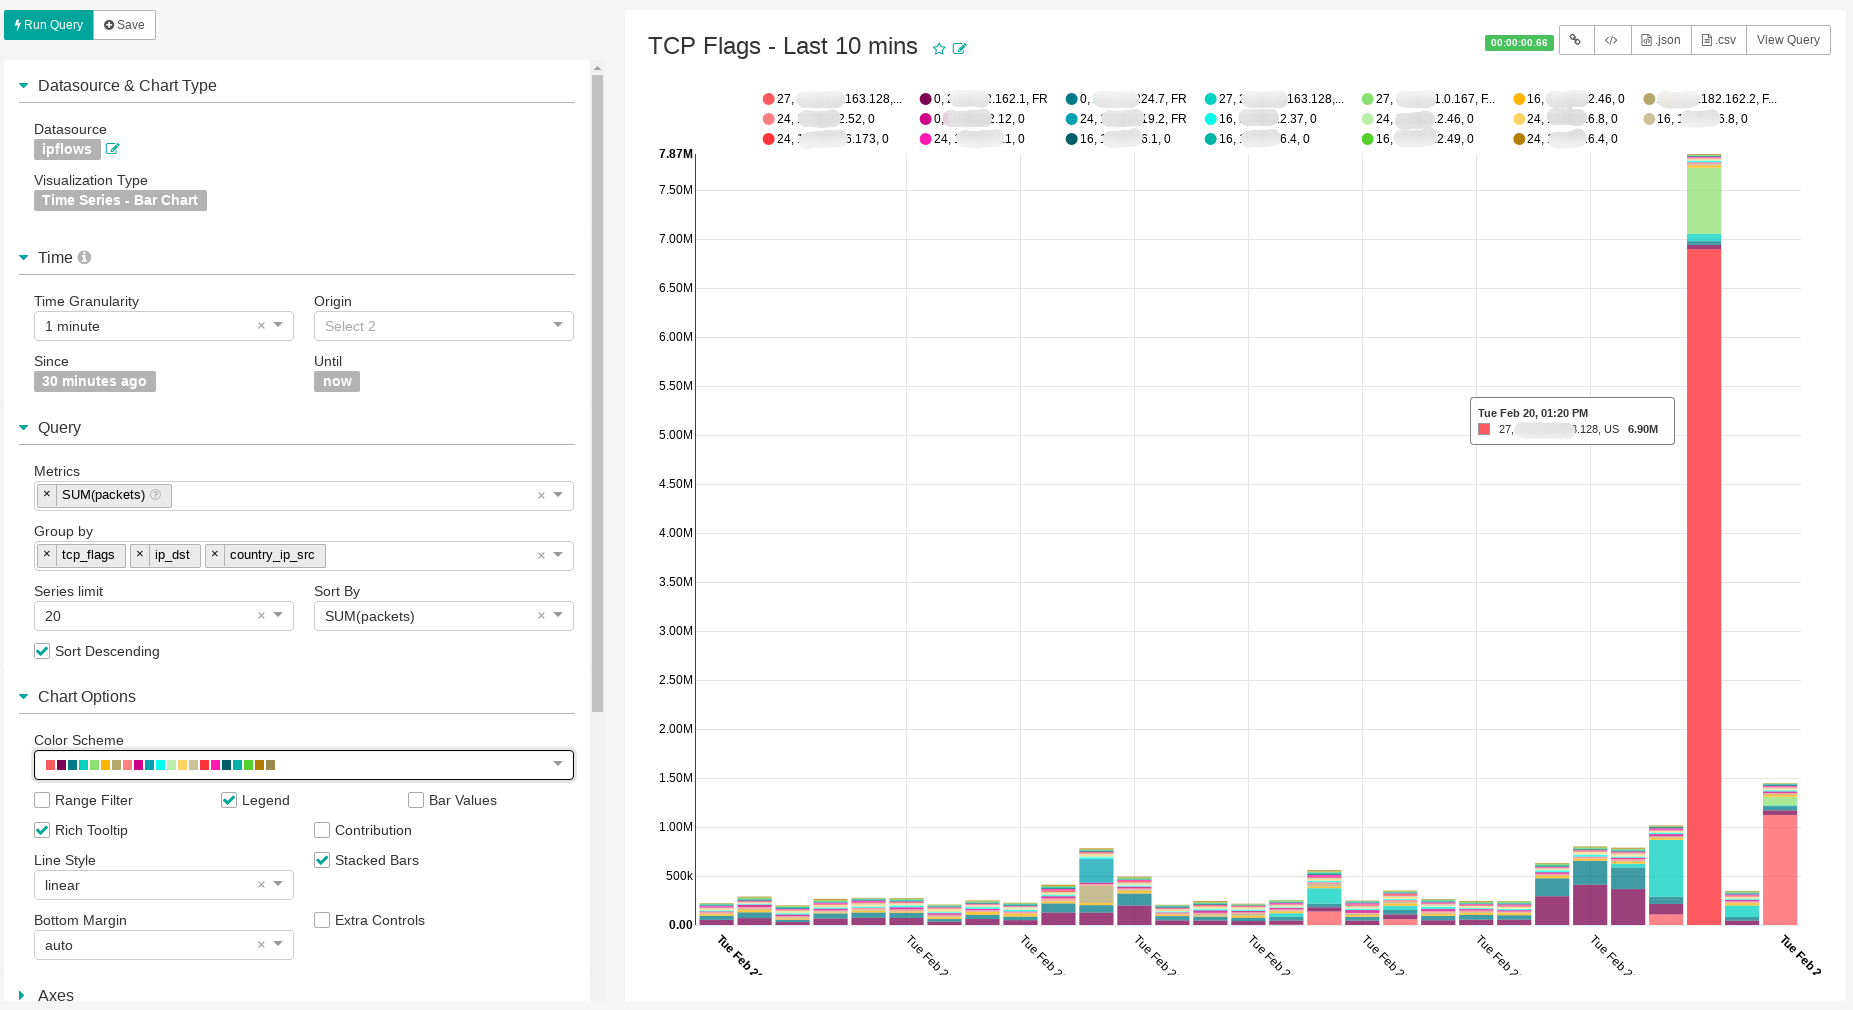
Post mortem analysis and security
In this example, we can analyze a DDoS attack. This is a TCP SYN flood from the USA to a client server. It is thus possible to place this type of request in a security dashboard and to be able to investigate in real time when a problem of performance or availability occurs without explanation.
We see, on this graph, packets with a TCP flag, all going to the same destination and having the source of the traffic grouped by country. We can see an attack of almost 8 million packets per second.